Overview
Another Saturday, another blog post. In a completely unrelated note, I really miss Saturday morning cartoons 🙂 I was watching the latest Microsoft Security Insights show (Microsoft Security Insights Show Ep. 103 – YouTube) and saw some workbooks that Jing Nghik had created.
In one spot he showed a spot where a workbook could call another workbook. That got me thinking that I could use this as a different way of doing a drilldown in workbooks.
The code for this blog post is located at garybushey/AzureWorkbookDrilldownII (github.com)
Setup
If you have not read the first post in this series located at Mimic drilldown in a Microsoft Sentinel workbook – Yet Another Security Blog (garybushey.com) I would recommend that since I will not be going over recreating the initial setup.
We are only going to modify the workbook that was created in that blog post slightly rather than recreate it.
Second workbook
We will be creating a second workbook that we will use as our drilldown workbook rather than just a tab as shown in the previous blog post.
Since I am feeling lazy, I am just going to create a new workbook, called “DrillIntoWorkbook” and once we are done modifying it, it will look like the picture shown below.
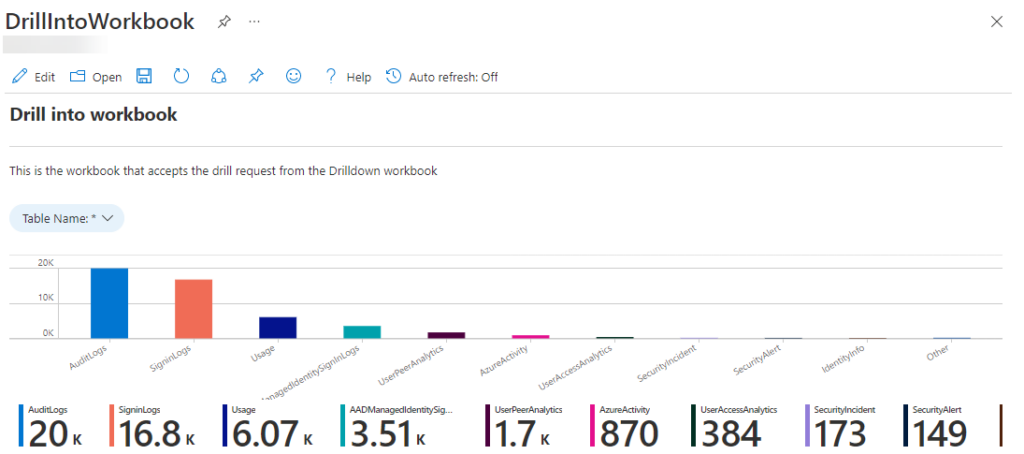
As you can see, all I have done is to change the first text block a bit. I then added a new parameter, see the original blog post on how to do that, that is a text type. I set the default value for it to “*”, so that all tables are loaded by default. I also made sure that the parameter name is “TableName” so its value can be used in the KQL below. It is worth noting that, unlike what we had to do in the first blog post, we do NOT need to make this a global parameter unless your new workbook is using groups as well.
For the bar chart, I did need to change the query a bit. We want to be able to filter by whatever table is being passed in, so we need to take that into account. The KQL I ended up with is shown below.
union withsource=_TableName {TableName}
| summarize Count=count() by _TableName
| render barchart
Obtaining the workbook’s location
One thing we will need to do is get the URL that will point to the workbook we want to drill into. Turns out this is fairly easy.
Open the workbook in your browser and then copy the entire URL from your browser. I find that pasting it into something like Notepad or VSCode makes the next steps easier. Here is the part that is a bit maddening. Even though the URL uses encoding for the location of the workbook (i.e. use “%2F” rather than “/”), this URL cannot be used inside a workbook, hence the need to decode the URL. There are plenty of online resources to do this for you.
- Decode the URL
- Locate the text “ConfigurationId/” in the URL
- Copy everything after that until “/Source”
- The copied text is the location of your workbook. The image below shows how it works for my workbook. The yellow highlights are the text to look for and the green highlight shows the text to copy.

Modifying original workbook
Back in the original workbook we created in the first blog post, we will need to modify the “Drill down” link. Edit the workbook and then edit that link.
Change the “Action” to “Workbook (Template)”. You may be thinking that this means it will only work with workbook templates, I know I did. But some testing determined that this is incorrect, you can use your own workbooks as well!
Paste the URL you copied from the steps above into the “Value” field. It should look like the image below
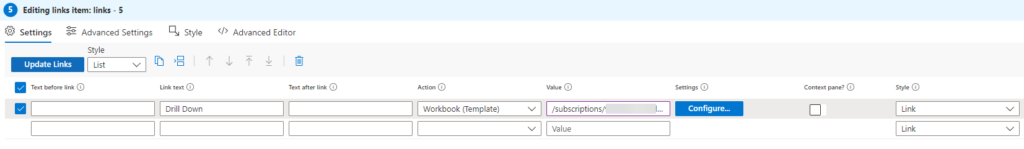
Click on the “Configure” button to continue making changes. We need to be able to pass in our selected value into the new workbook. To do this, at the bottom of the “Workbook Link Settings” pane, we need to add “Workbook Template Parameters”.
Since we called the parameter in our new workbook “TableName”, we need to set that as the name of the parameter. Change the “Source” to “Parameter”, and set the “Value” to the parameter we want to pass in, or “X” in this case.
Now, if you try to click the “Save and Close” button, you will get a warning that you will lose your changes. This appears to be a bug that has been reported. Just go ahead and change another setting. I change the “Location comes from” to “Workbook”. You can then click the “Save and Close” button.
Go ahead and click the “Done Editing” buttons and save your workbook, just in case.
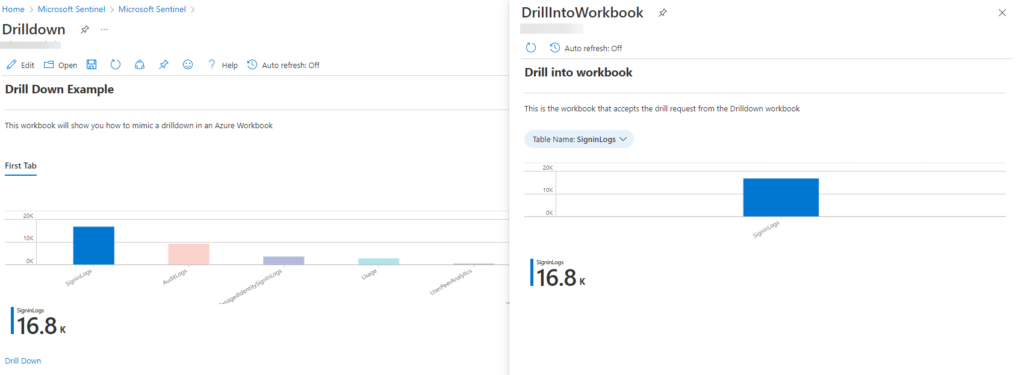
Now, select one table in the bar chart and click on the “Drill Down” link. If everything was done correctly, your new drill into workbook will display and only show the selected table. You can click on the “X” in the upper right-hand corner to close this workbook and return to the original.
But wait! There’s more!
If you look back at Figure 3 above, just to the right of the “Configure” button is a checkbox labeled “Context pane”. If you check that, save everything, and then click the link, your new workbook will open as a new pane on the right side of your screen as shown below!
Summary
You saw how you can use another workbook as your drill-down. You can do this as a stand-alone workbook, or you can show it in a context menu. Just imagine the possiblilities!
If you watch the video mentioned above, you will see that Jing has done other cool things using this same type of functionality. Azure workbooks are improving all the time!