Overview
EDIT: If you need to use this information in workbook, take a look at the “Log Sources & Analytics Rules Coverage” workbook. It uses a combination of ARM templates, JSON, and Regex to show which rules are enabled for a selected table. Very cool!
Microsoft Sentinel can show you which MITRE tactics and techniques that are being used with your rules to see the total coverage. But how about which tables are being covered?
Unfortunately, this data is not stored anywhere that is accessible. It would be nice to have a place to enter the tables being used when creating a rule but who knows if or when that will ever happen.
In the meantime, you can get an approximate number of rules accessing your table using the steps listed in this post. It is comprised of three parts:
- A Logic App that uses the Alert Rules API to get a listing of all the rules. I will not walk you through all the steps to get this working but will just provide an overview mainly because the way I interact with Watchlists through a Logic App is out of date and I have not yet updated my Logic App.
- A watchlist that is created from a Logic App.
- A KQL query that shows how to use this information. I use it as part of an Azure workbook and show the information as tiles.
Logic App
As I said, I am not going into a lot of details here. The basic steps are:
- Call the REST API to get a listing of all the analytic rules you have enabled. This page has the API information needed: Alert Rules – List – REST API (Azure Sentinel) | Microsoft Docs.
- For each entry in the list, parse the JSON for each rule so you can get to the query and kind of rule. There may be other useful information as well you may want to store in the watchlist including the rule name and ID. At a minimum I would suggest saving the “description” and the “query” fields which are under the “properties” field.
- If the rule is a scheduled rule, continue. A scheduled rule is the only kind that will show the KQL being used in it, so those are the only ones we care about. This is determined by looking at the “kind” field in the entry.
- You will probably want to get rid of all the “\n” and commas in the KQL code so that it can be stored correctly in the watchlist
- Save all your data into the watchlist
I set my Logic App to run each week to update the rules which seems to work pretty well.
Watchlist
You can call the watchlist anything you like. In this example, I call mine “RuleQueries” and I save the KQL queries in a column called “Query”
KQL
Once you have the watchlist created, you will load it into a table. Then you will create another table that is the union of all the tables. You will use the names of this second table to check the queries from the watchlist. The code is shown below:
//Load a table with the information from the watchlist.  We only care about the Query here
//since we will be using that to get a count.  Add the Value column to perform a match
//in the join later
let ruleQueries = _GetWatchlist('RuleQueries') | project Query | extend Value=1;

//Create a temp table that has a listing of all the table names. Add the Value column to perform a match
//in the join later.   Took this part of the query from Clive Watson's workbook that shows table ingestion
let Tables = (union withsource=TableName1 *
| distinct TableName1
| project TableName = TableName1
| order by TableName asc
| extend Value=1);

//Iterate through the table and see if that table name is used in any of the queries
//that came from the watchlist.  If so, increment the count for that table.
Tables
| join kind=fullouter ruleQueries on Value
| order by TableName,Query asc
| summarize countif(Query contains TableName) by TableName
I have to add a new column to both tables called “Value” so that I could perform a match on both. I would also suggest looking as far back as you can to get the listing of tables. Any table that hasn’t had activity within the selected timespan will not show up. That may or may not be a big deal for you. If the table hasn’t had any activity in a while, does it matter if a rule tries to access it? That is up to you do decide.
This query uses the “contains” command and this is where the approximation comes into play. If you have a table called “Activity” and another called “Activity_CL” and both are used in analytic rules then, when the check to see if “Activity” is used, it will match for those rules accessing both “Activity” and “Activity_CL”. Worse case is you may get more hits for “Activity” then expected.
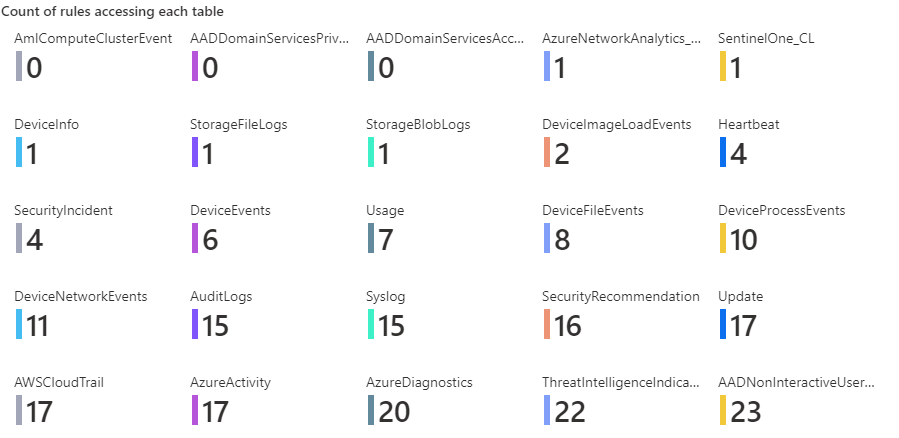
If you post this query into an Azure workbook’s query step and set the visualization to “Tiles” you will get a nice view of how many rules are accessing each table as shown below.
Summary
This blog post shows how to determine which tables are being covered by different rules (approximately). It uses a Logic App to create a watchlist which is then used in a KQL query in a workbook to get the view shown above.
This can easily be extended so that when you click on one of the tiles, you get information regarding the analytic rule. This can be gathered from the watchlist or, if you store the rule’s ID, by making a call to the REST API to get the rule information within the workbook.