Introduction
For most people using Microsoft Sentinel, you would login the Azure portal, go to the Sentinel page (and maybe select the required instance), go to workbooks, and select the workbook you want to see.
That is great, but what if you are a CISO and you don’t want to have to go through all the steps? This blog post will tell you how you can pin parts of a workbook to a dashboard and have that dashboard show up when logging into the portal.
First, you should understand there are differences between workbooks and dashboards. For those that have been using Microsoft Sentinel for a while may remember that originally it used dashboards instead of workbooks for its reports. Each has its pluses and minuses, and I will not be going into that here. Rather we will be using a combination of both to accomplish our goal.
Of course, you will need to know which workbook you want to pin to the dashboard. You can pin either an entire workbook or just a part (known as a step in workbook lingo) to a dashboard. My preference is to pin just the steps you want to see since, if you pin an entire workbook, you will still need to go into workbooks to see it as shown later. You will, most likely, also need to be able to edit the workbook so your workbook needs to be available under the “My workbooks” tab. In this example we will work with the “Security Operations Efficiency” workbook.
Little side note, this workbook is available in the header when looking at the listing of incidents, but it is called the “Security efficiency workbook” there. No idea why it is done that way.
Save the workbook to edit
First, go into the “Workbooks” are in Microsoft Sentinel and find the “Security Operations Efficiency” workbook in the “Templates” tab. If you have already saved this workbook, you can skip this step. I find the easiest way to do this is to just search for the name in the search bar in the header as shown below

Select the “Security Operations Efficiency” workbook and then, in the details pane that opens on the right hand side of the screen, click on the “Save” button. You will be asked what region to use when saving the workbook. Just use the same region as your Microsoft Sentinel instance is using.
When the workbook is done saving, click on the new “View saved workbook” button to open the workbook. We will need to edit this workbook so we can pin the needed steps.
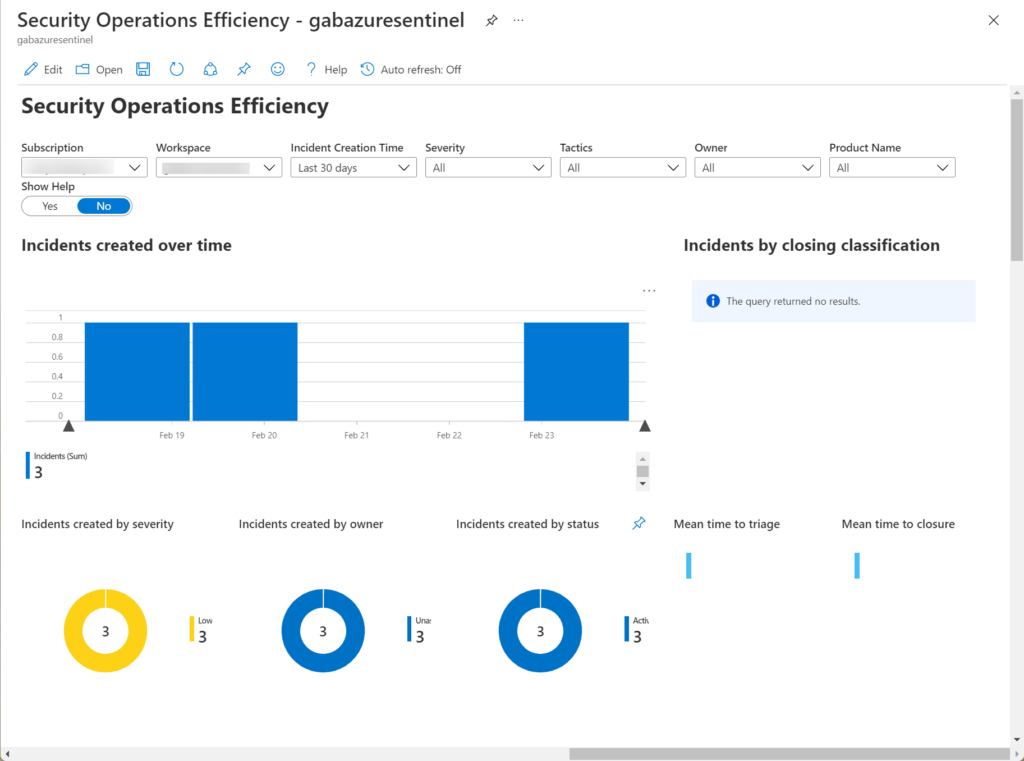
When the workbook is open it should look similiar to what is shown below. The actual values will be different so don’t worry about that too much.
Pin a workbook step
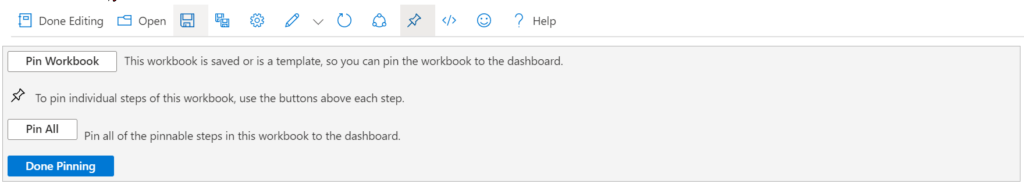
We need to be able to pin each individual step to a dashboard so we will need to edit the workbook (at least most of the time, more on that later). Click on the Edit button in the header and then and then click on the button that looks like a push pin. When you are done it will look like the image shown below
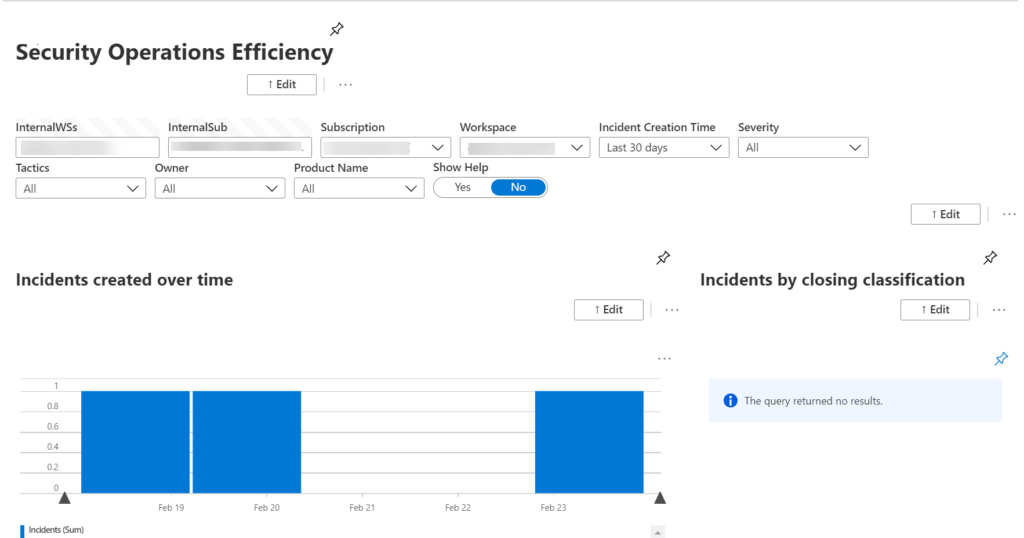
Over most of the steps you will see a little push pin icon as well. These are the steps that can be pinned to a dashboard as shown below. Notice that the step containing all the parameters does not have a pushpin, which make sense since why would you just have the parameters? Also note that the step that just has text in does have a pushpin so you can pin instructions or some overview text.
What we are going to do next is to select the push pin icon over the “Incidents created by severity” step (you may need to scroll down a bit to see it). Select the push pin over it and notice that a new pane will open on the right side of the screen with options.
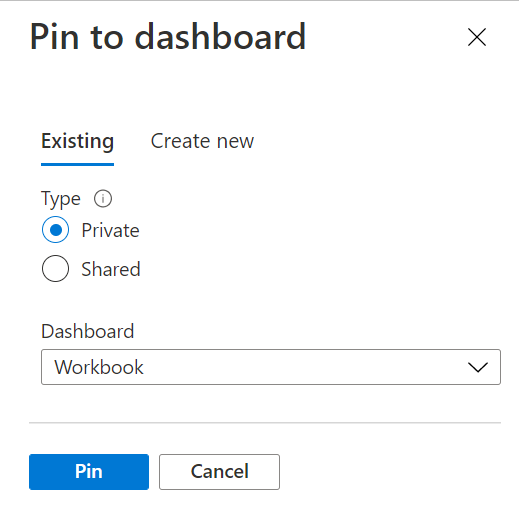
If you already have a dashboard that you can use, you can use the “Existing” tab. For this post, I am going to create a new dashboard so click on the “Create new” tab. The pane will change as shown below.
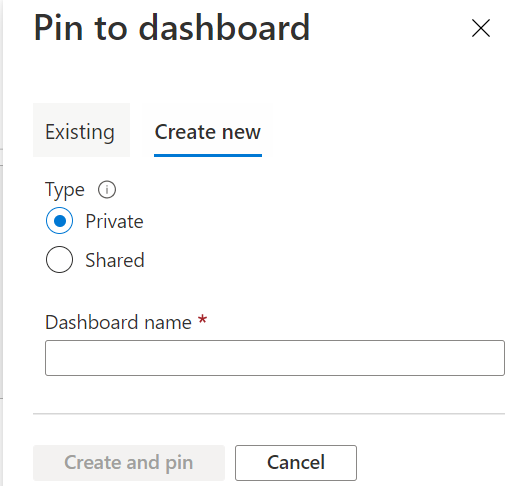
Select whether you want the dashboard to be private, where only you can see it, or shared, where everyone can see it. If you create a “Shared” dashboard, you will be asked for the subscription and region to store the dashboard. The defaults should work for you just fine. Then give it a name. I am going to create a shared dashboard called BlogPost”. Click on the “Create and pin” button to create your new dashboard.
View the dashboard
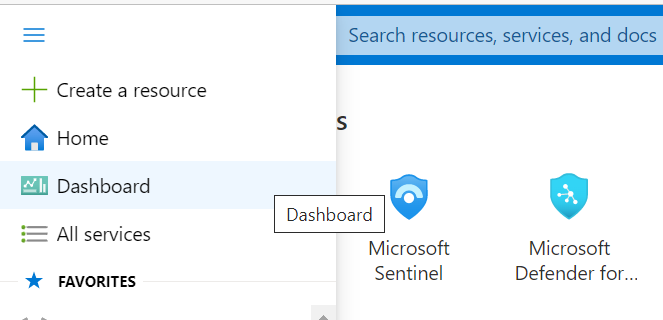
Now go to the portal’s home page and in the upper left-hand corner, select the portal menu icon (looks like 3 horizontal lines) and select the dashboard entry
This will take you to the dashboard page. In the upper left-hand corner of the screen is a drop down that will list all of your dashboard. Select the dashboard you just created.
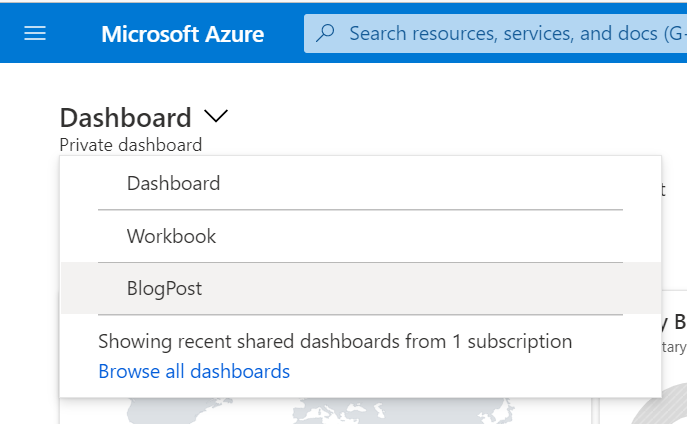
Image 8 – Select new dashboard
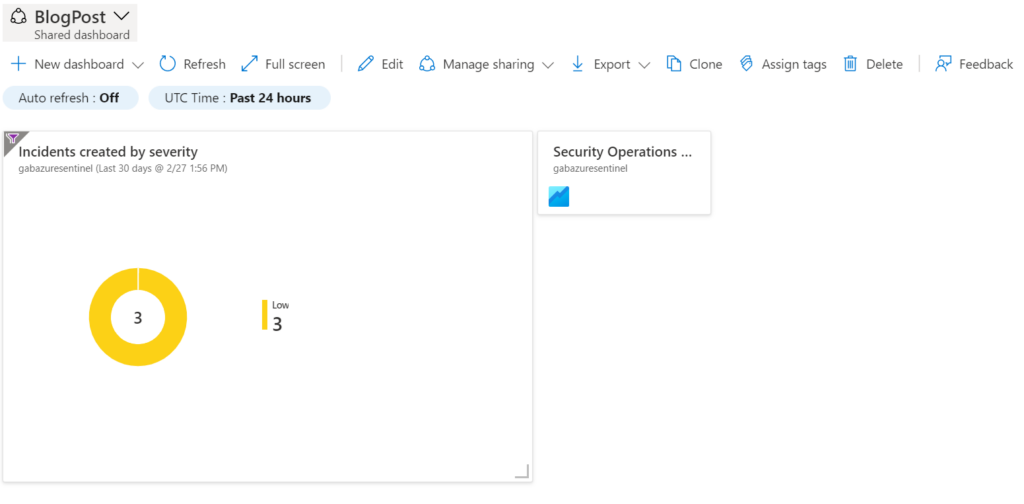
The image below shows how the new dashboard looked when I looked at it. You may be wondering why I am not seeing any data in the tile when I had some data in it when viewing the workbook (believe me, I sure did when I first saw this). The answer is that the tile is using the default time value which is probably different than the default time the workbook was using. There are two different ways to handle this.
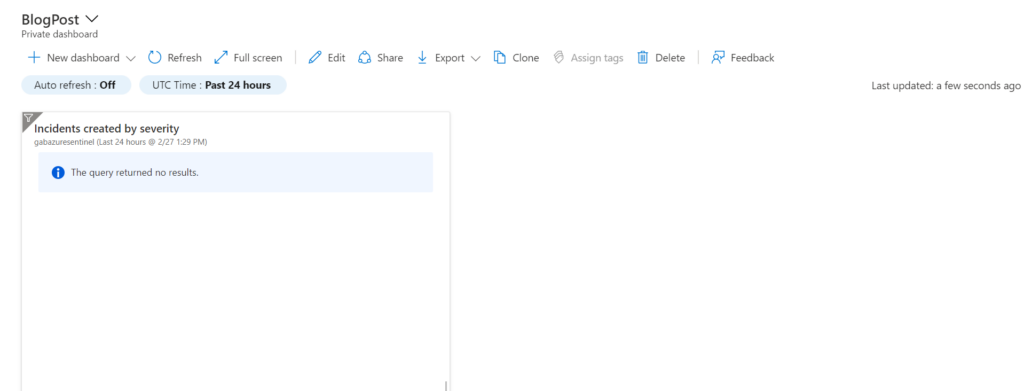
The first way will change the default time value for the entire dashboard. If you look at the header for the dashboard you will see a dropdown for the time. In the image above it is showing “UTC Time: Past 24 hours”. You can change the value in that dropdown to change the default time value for the entire dashboard.
The second option will change the default time for just a single tile. Move your cursor into the tile and then, in the upper right-hand corner it, select the context menu and then select “Configure tile settings”. This will open the new blade as shown below
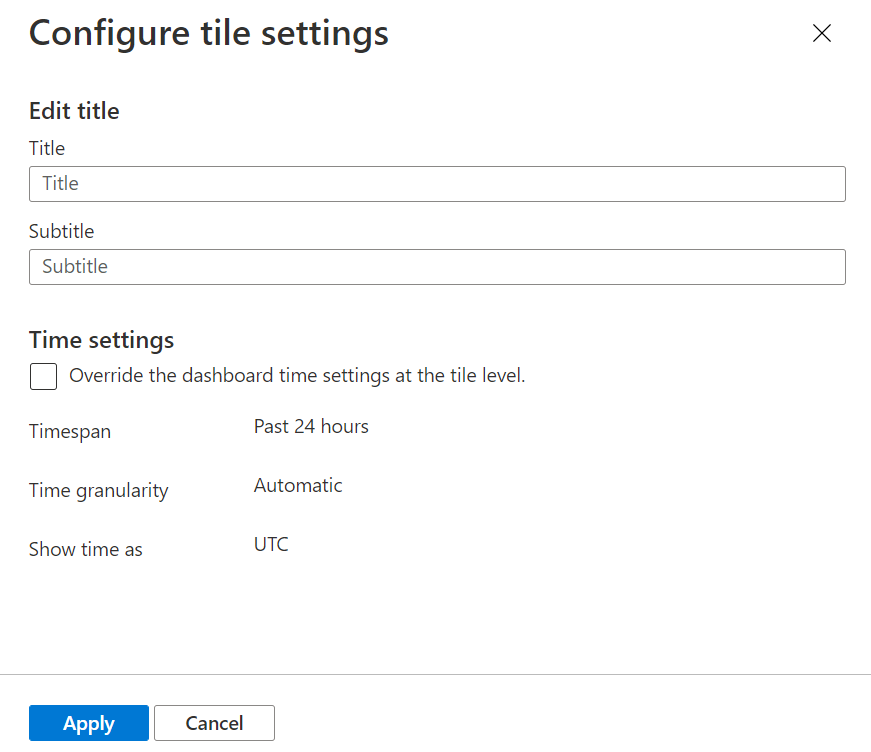
Select the checkbox labeled “Override the dashboard time settings at the tile level” and then change the “Timespan” entry to “Past 30 days” or whatever time span you like. Click the “Apply” button to save the new settings.
Now the tile looks right. This shows one limiting factor of pinning a workbook step to a dashboard. You lose the ability to change the parameters you are using, other than the time. However, if you click on the tile, it will take you directly into the workbook where you can change the parameters as needed, however the changes will not affect the tile at all.
You will now need to click the “Save” button at the top of the page so that the changes you just made will be saved for future viewings.
Go ahead and add the “Incidents created by owner” and “Incidents created by status” to this dashboard. You should be able to do so easily now that you have the dashboard already created.
Show dashboard on portal start up
So now we have a dashboard that will show up when we want to, we need to be able to see this immediately when we log into the portal. To do this we need to modify the portal settings itself.
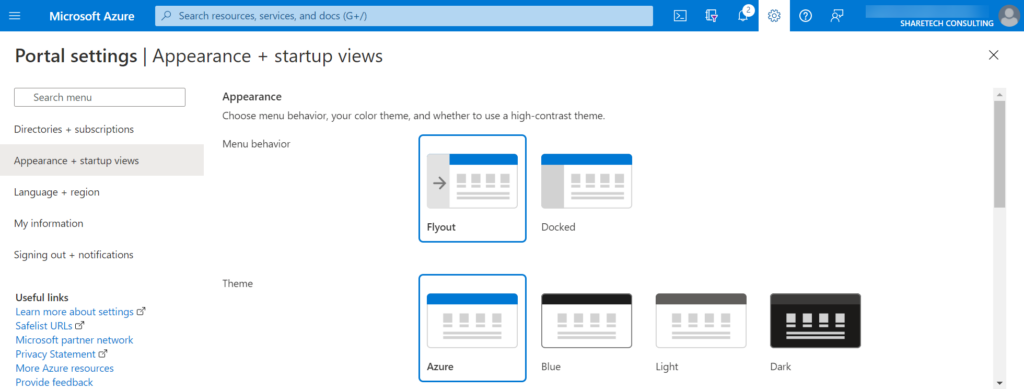
Click on the Settings icon on the portal’s header bar and then click on the “Appearance + startup views” menu entry in the left-hand side.
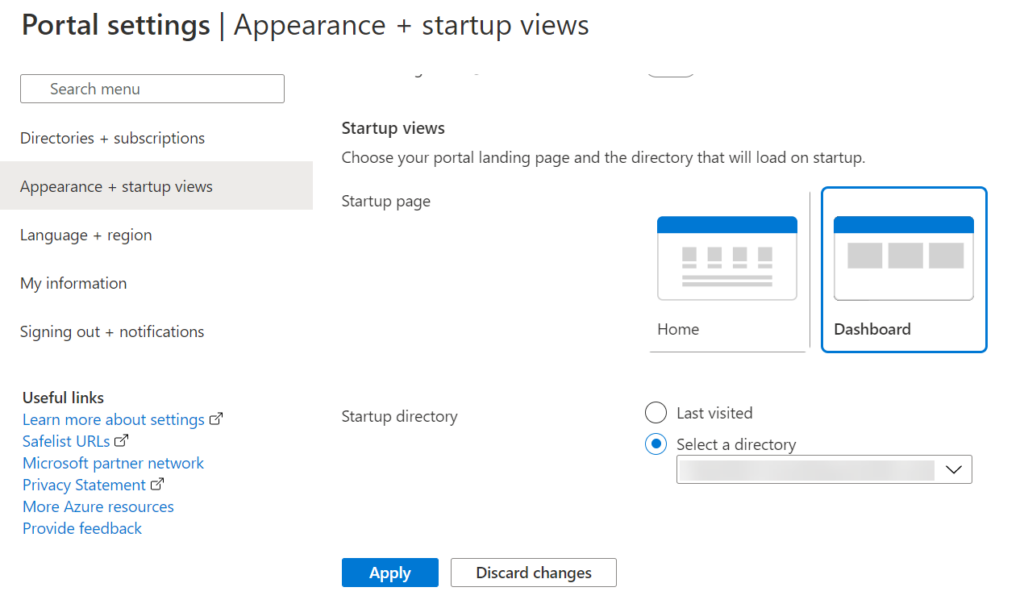
Scroll down the page until you get to the “Startup views” section. Change the “Startup page” to “Dashboard” and click “Apply”
Now when you go into the Azure Portal, you will always be taken into the last viewed dashboard!
Pin and entire workbook
As previously mentioned, you can pin an entire workbook to a dashboard. We will go over those steps here.
There are two different wants you can pin the entire work. First, if you are not editing the workbook, the push pin icon in the workbook’s header will pin the entire workbook. See image 2 for a view of the header.
The second way is to click on the “Pin Workbook” button in the header that opens up when you click on the push pin icon while editing a workbook as shown in image 3.
Either way will open the “Pin to dashboard” pane as shown in image 6. Follow the same steps as if you were pinning a step. Now if you go to your dashboard it will look like the image shown below. Notice that the full workbook is not shown, just a tile that represents the workbook. If you click on the tile, it will take you into the full workbook so you can think of this as a shortcut into the workbook.
Since clicking on either tile will take you into the workbook, you will need to decide if you want to see any information in the dashboard or just treat it as a repository of shortcuts.
A bit of trickery
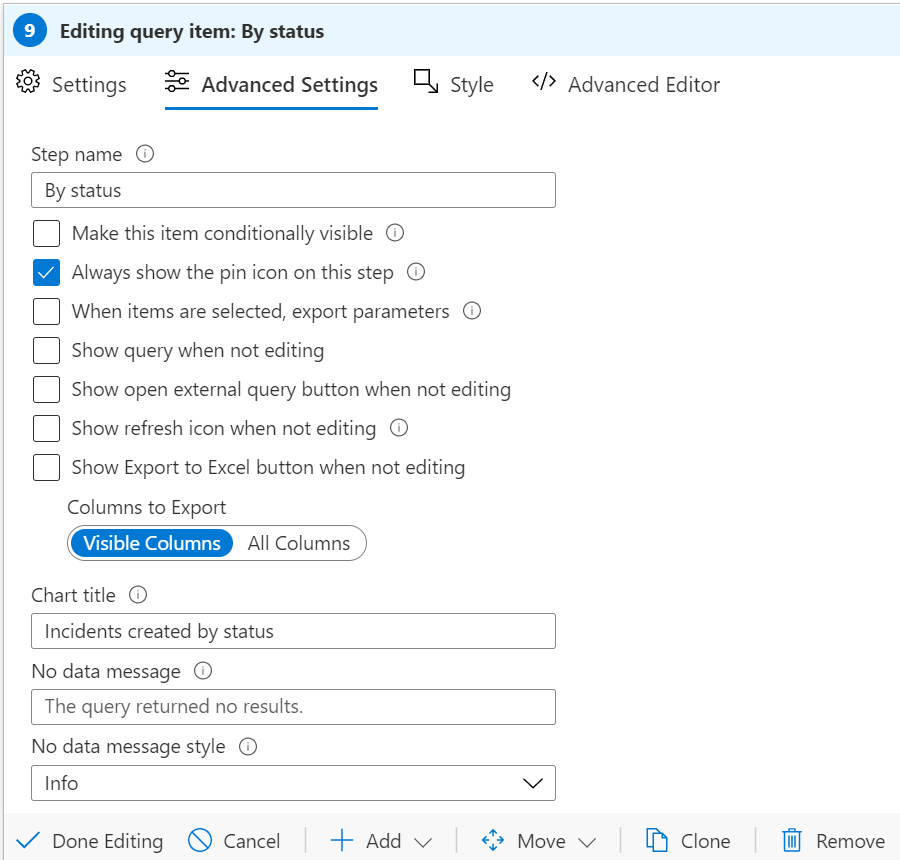
Looking back at image 2, some of you may have noticed there is something different about the “Incidents created by status” step. Even though we are not editing the workbook and have not clicked on the push pin icon in the header, there is a push pin showing. This is because any step that you can pin to a dashboard has the ability to always allow users to pin it to the dashboard. This is useful if you need to allow users to create dashboards without giving them the ability to edit a workbook.
If you edit the step (when you are editing the workbook, just click edit on the individual step) and click on the “Advanced Settings” tab, there is a checkbox labeled “Always show the pin icon on this step”. Check it and click “Done Editing” to always have the push pin show as shown below.
Summary
The blog post showed you have to save workbook steps, or an entire workbook, to a dashboard as well as how to have that dashboard show up whenever you go into the portal. In some upcoming posts I am going to cover an additional way to create reports. Hint, it begins with “Power” and ends with “BI”.