Introduction
In Ingesting Azure Sentinel Incident information into Log Analytics, I showed you how to create a Log Analytics workflow to ingest Azure Sentinel Incidents into a Log Analytics workspace. In Ingesting Azure Sentinel Incident information into Log Analytics Part II, I fixed some of the issues I ran into while using the instructions from part I.
Now I will show you how to use the data you have ingested in a workbook. This is what I have so far and I am sure I will be expanding it in the future as I get new ideas/requests.
First, I would like to thank Microsoft’s Clive Watson for his workbook that he created to show Usage reporting. I used a lot of the techniques he used in mine, including using variables in a Text step (which I didn’t know you could do) and creating a field that shows how long ago something occurred and displaying it in a heatmap. You can get more information on his workbook here: https://techcommunity.microsoft.com/t5/azure-sentinel/usage-reporting-for-azure-sentinel/ba-p/1267383
The workbook
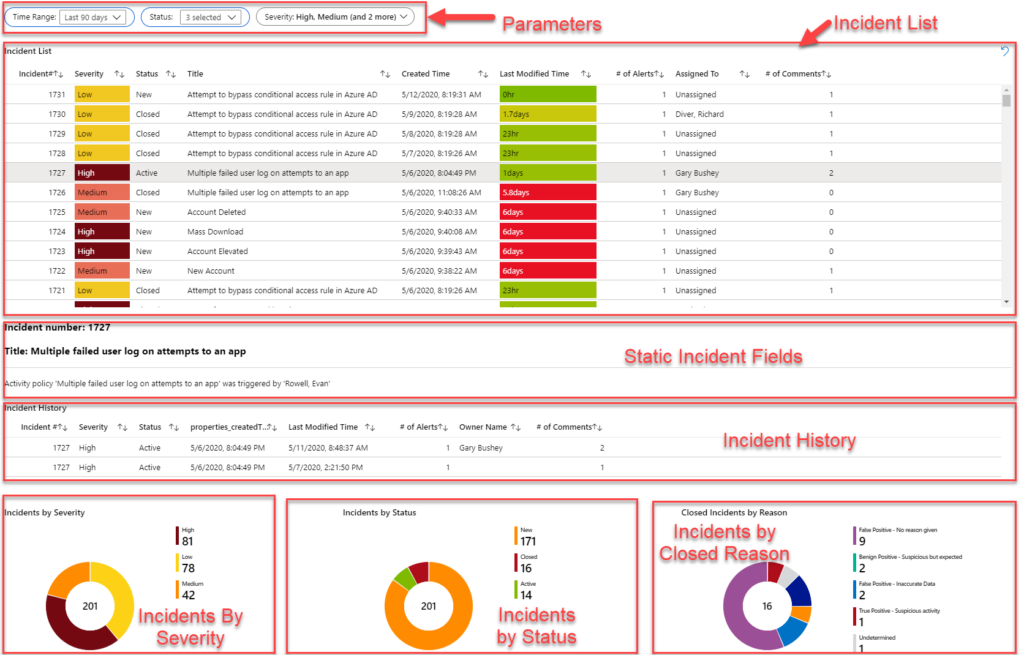
The image below shows the workbook as it stands right now. The red boxes show the various steps created. I am not going to go into details on how I created these steps except for a few cases.
Just to plug my book one more time, I do go into quite a bit of detail in the Workbooks chapter on how to create and modify a workbook. It can be found at: https://www.amazon.com/Learn-Azure-Sentinel-artificial-intelligence/dp/183898092X/ref=sr_1_1_sspa?dchild=1&keywords=azure+sentinel&qid=1589291957&sr=8-1-spons&psc=1&spLa=ZW5jcnlwdGVkUXVhbGlmaWVyPUFKWDg0N0gyUzRVTUEmZW5jcnlwdGVkSWQ9QTAyMzkzMTExNDA2RUEzMFBTSU8yJmVuY3J5cHRlZEFkSWQ9QTAxODg4ODMxVVlDV1dKRzBQSzNKJndpZGdldE5hbWU9c3BfYXRmJmFjdGlvbj1jbGlja1JlZGlyZWN0JmRvTm90TG9nQ2xpY2s9dHJ1ZQ==
BTW, the Medium status in the Incidents List is supposed to be orange but there appears to be a bug that makes it the color that is shown. A bug report has been filed so hopefully it will be resolved soon.
Main Code
The main code that I use for the Incident Listing is pretty self-explanatory but some of the lines need some explanation. Sorry, my code formatting plug-in does not understand KQL.
let lastUpdates = SentinelIncidents_CL |  summarize properties_lastModifiedTimeUtc_t = max(properties_lastModifiedTimeUtc_t)  by properties_incidentNumber_d;
lastUpdates | join kind=rightsemi (SentinelIncidents_CL) on properties_lastModifiedTimeUtc_t
| where properties_createdTimeUtc_t {TimeRange:query}
| where properties_status_s in ({Status})
| where properties_severity_s in ({Severity})
| extend last_updated = datetime_diff("hour",now(), properties_lastModifiedTimeUtc_t), assignedTo = iff(isempty(properties_owner_assignedTo_s),"Unassigned",properties_owner_assignedTo_s)
| order by properties_incidentNumber_d
| project properties_incidentNumber_d, properties_severity_s, properties_status_s, properties_title_s, properties_createdTimeUtc_t, properties_lastModifiedTimeUtc_t, last_updated, properties_additionalData_alertsCount_d, properties_owner_assignedTo_s, properties_description_s, properties_additionalData_commentsCount_d
- I use this line to get a listing of the last modified date for each incident. Since each incident can have multiple entries in the table I use the max(properties_lsatModifiedTimeUtc_c) to get the latest modification date.
- This uses the dates from the first line and then does a join with the table again. I use a rightsemi join to get just the columns from the table on the right side of the join to avoid duplicate columns.
- This filters the creation date and time based on the TimeRange filter. The query portion will return code like ago(7d).
- This filters the status by the selected values from the parameter
- This filters the severity by the selected values from the parameter
- The first field is used for the last modified time (See below). The second field will check to see if the assigned to field is empty. If it is then it will be set to Unassigned, otherwise the field’s value will be used.
- Orders the table by the incident number
- Projects just those fields we need. Some of those fields will be hidden in the grid, but are needed for the variables being generated.
Some interesting features
At least I found them interesting 😉 These are also things I have learned after writing the chapter for my book.
Severity color
The workspace’s grid visualization allows for customizing how the individual columns are displayed (called renderers). One of those renderers is called Thresholds. A threshold allows you to specify a range of numbers or specific text, that should translate to icons or colors. I used this to show the severity color as well as the text in the column. All the settings are shown below
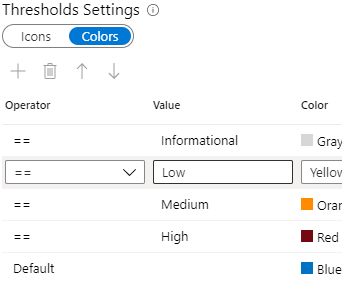
Sorry for the lousy picture but the workbook pane does not allow for resizing even on a very wide monitor. This shows what the orange color should look like!
Last Modified Time
I admit it, I stole this from Clive’s workbook with some slight modifications. The line of KQL that I use to generate this is:
extend last_updated = datetime_diff("hour",now(), properties_lastModifiedTimeUtc_t)
This it taking the current date/time, subtracting the last time the incident was modified, and converting the time into hours.
I then use a heatmap as the column’s renderer. Use the Green to Red color palette, enable Custom formatting, set the Units to hours, and Maximum significant digits to 2.
Using variables in text
This is another trick I got from Clive’s workbook. When using a Text step you can use your variables and parameters in it.
For example, to show the static information about a selected incident I use
### Incident number: {incidentNumber}

### Title: {Title}

---

{Description}
This will show the 3 variables that I have enabled in the Incident list step.
Summary
That is the workbook in a nutshell. The code for this can be found at:
https://github.com/garybushey/IncidentsWorkbook
I have found that when looking at the JSON file it is better to view it as RAW to avoid any weirdness. You can create a new workbook, edit it, select Advanced Editor (which looks like </>), select all the text in the new view and replace it with the code from GitHub. I used SentinelIncidents_CL as the name of my table so you may need to change it to whatever you have used.